Choosing the best Dc Fast Charging Station in 2026 means looking beyond its peak power rating. Drivers need dependable chargers, clear pricing, accessible locations, and connectors that match their vehicles. A powerful unit is not automatically a useful one.
The International Energy Agency’s Global EV Outlook 2024 reported more than four million public charging points worldwide by the end of 2023. Public charging grew by about 40% that year, while fast-charger numbers rose by roughly 55%. Those figures show why station choice matters. They also show how quickly comparisons can become outdated. The U.S. Department of Energy’s Alternative Fuels Data Center provides location and equipment details for public charging sites, helping drivers check what is actually available.
Still, published specifications do not tell the whole story. A 350-kW charger may deliver less power when a vehicle’s battery is cold, nearly full, or limited by its onboard system. Small details matter: a readable screen, a cable that reaches the inlet, and a working payment option. Nothing flashy. This guide compares station performance, network coverage, connector compatibility, pricing transparency, and real-world usability. It also treats ratings cautiously, because one failed visit can shape an impression, while a handful of smooth stops cannot prove long-term reliability. The best choice depends on your route and vehicle, not just the biggest number on the cabinet. That distinction is easy to miss.
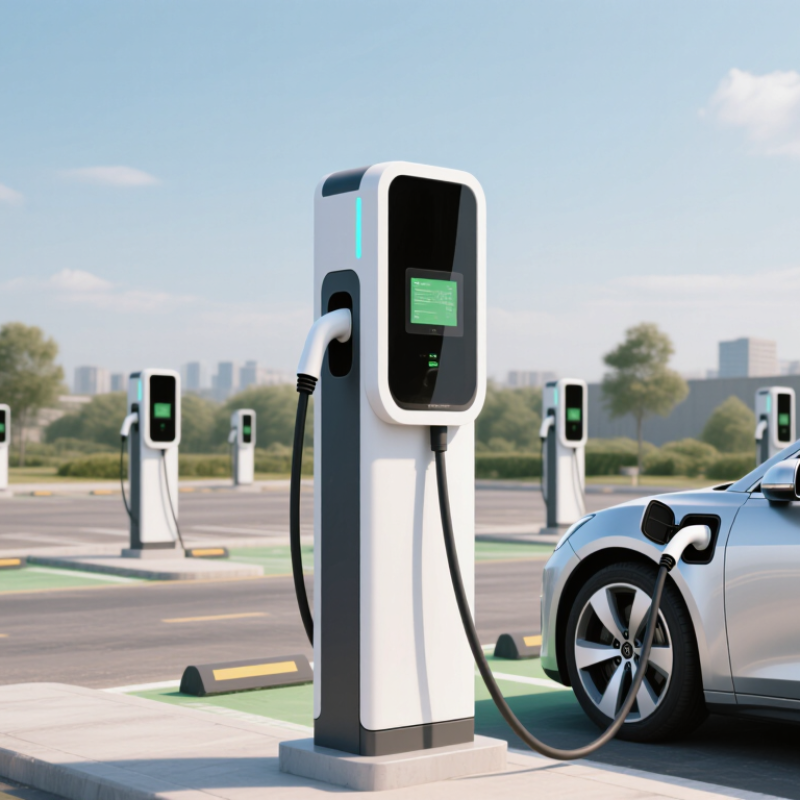
A DC fast charging station converts electricity from the grid into direct current and sends it to a vehicle’s battery. This bypasses the car’s onboard AC charger, allowing higher charging power. Before charging begins, the station and vehicle communicate. The battery management system reports its needs, while the station checks what power it can safely provide.
Charging speed changes during a session. A cool battery with a low charge may accept power quickly, but speed usually drops as the battery fills or warms. The number on a station’s screen is a peak rating, not a promise of constant speed. Shared power between charging bays can also affect the result. It’s not always obvious.
Tips: Check your vehicle’s maximum DC charging rate and connector before choosing a station. For a faster stop, arrive with a low-to-moderate charge when practical, and avoid charging to full unless you need the range. Weather, battery temperature, and station conditions matter, too. A slower session does not automatically mean something is broken. Still, repeated interruptions deserve attention.
Illustrative comparison of the ideal time to deliver 50 kWh at common DC fast-charger power ratings.
DC fast chargers convert grid power to DC and supply it directly to the vehicle’s battery. The vehicle’s battery-management system controls how much power it can accept. The chart’s times are ideal calculations (50 kWh divided by rated power) and exclude charging losses and power taper, so actual charging can take longer.
Choosing the best DC fast charging station in 2026 means comparing more than its peak kilowatt rating. That number describes a possible maximum, not the speed every vehicle will receive. Check whether the charger’s output matches your car’s charging limit, then look for real-world session data across different battery levels. A useful comparison includes charging time from 10 to 80 percent, not just a brief peak. Battery temperature, starting charge, and shared power can all change the result. Numbers can mislead.
Also check connector compatibility, cable reach, screen readability, and how clearly prices appear before a session. These details matter on a rainy evening, when a stiff cable or confusing payment screen can turn a quick stop into a frustrating one. For operators, compare power sharing across stalls, uptime records, maintenance response, and pricing structure. A station that serves several cars reliably may be more useful than one with a higher headline rating. I sometimes give peak speed too much weight; dependable service and clear costs deserve equal attention. No comparison is perfect, so weigh measured performance against the conditions you actually face.
The best station depends on the vehicle, site, and charging pattern. The International Energy Agency’s Global EV Outlook 2024 reported that public charging points grew by more than 40% worldwide in 2023, while fast chargers grew by about 55%. That growth raises the bar for reliable, easy-to-use equipment. The U.S. Department of Energy’s Alternative Fuels Data Center describes DC fast chargers in power ranges commonly starting around 50 kW, with newer units reaching several hundred kilowatts. More power is not always faster: the vehicle’s charging limit, battery temperature, and shared site capacity all matter. Specifications can mislead.
For a practical comparison, check sustained output, connector compatibility, and whether power is shared between two plugged-in vehicles. Look for cables that reach across parking spaces, clear status displays, and payment steps that work without guesswork. Remote fault alerts and published uptime figures are useful, too; a broken high-power unit is still broken. Site design matters. Shade, lighting, and accessible parking can make a brief stop less frustrating. Operators should disclose how uptime is measured, since a single percentage can hide repeated short outages. I’d also inspect performance during busy periods, not just at an empty test site. The details are easy to overlook.
The best DC fast charger in 2026 depends on the vehicle and site, not just its headline power rating. A compact EV may accept power more slowly than a larger vehicle, leaving a high-output unit underused. Check connector compatibility, peak charge rate, and the vehicle’s charging curve. The curve matters. A car may briefly accept high power, then slow as its battery fills or warms. In winter, battery temperature can change charging speed noticeably.
At a busy highway stop, prioritize reliable uptime, clear payment steps, cable reach, and enough stalls to reduce queues. At an apartment or workplace, lower power may suit longer parking periods and limited electrical capacity. Rural sites need careful planning for grid capacity, weather protection, service access, and future demand. Ask who will inspect the equipment and how quickly faults are handled. Small details matter. A heavy cable that barely reaches a vehicle’s charge port can frustrate drivers, even when the charger works. Compare installation costs, expected use, and local service support before choosing. Real traffic and charging habits rarely match a perfect forecast, so leave room to revise the plan.
A DC fast charging station is only as useful as the site around it. Before choosing equipment, check the utility connection, available electrical capacity, and room for safe vehicle access. A charger rated for high output may deliver less if the site cannot supply enough power. A qualified electrical contractor can assess the service and identify upgrades before installation begins. This early review can prevent expensive surprises.
Installation costs depend on more than the charger itself. Trenching, concrete work, switchgear, permits, and utility upgrades can change the budget substantially. Ask for an itemized estimate that separates equipment from site work. Operating costs also include electricity, network services, maintenance, and possible demand charges tied to peak power use. Low usage can make each charging session costly. That matters.
Long-term reliability depends on thoughtful placement and regular care. Keep equipment clear of standing water, snow piles, and frequent vehicle impacts. Confirm that technicians can reach cables, screens, and internal components without blocking traffic. Track faults, repair times, and charger availability; these records reveal recurring problems better than a brochure does. Even a well-designed station will need repairs. I would also leave room in the budget for cable replacement and unexpected service visits, because maintenance forecasts are rarely perfect.
| Station class | Typical rated power | Best fit | Indicative installed cost per port (U.S.) | Energy cost per delivered kWh | Long-term reliability considerations |
|---|---|---|---|---|---|
| Lower-power DC fast charging | Approximately 50 kW | Longer dwell-time locations, smaller sites, and vehicles with lower charging limits | About $30,000–$100,000; site electrical work can move the total outside this range | About $0.13 per kWh under the example assumptions below | Lower power requirements may simplify some sites. Check service access, spare parts, enclosure protection, and warranty coverage. |
| Mid-power DC fast charging | Approximately 150 kW | A balanced option for many public sites where vehicle turnover and grid capacity both matter | About $75,000–$200,000; utility upgrades, trenching, and site work are major variables | About $0.13 per kWh under the example assumptions below | A practical choice when utilization is expected to justify the investment. Confirm uptime reporting, remote diagnostics, and repair response commitments. |
| High-power DC fast charging | Approximately 350 kW | High-throughput highway or fleet sites with sufficient grid capacity and compatible vehicles | About $150,000–$400,000 or more; substantial utility and civil works can increase total cost | About $0.13 per kWh under the example assumptions below | Higher output does not guarantee faster charging for every vehicle. Evaluate cooling, cable handling, power sharing, maintenance access, and grid-demand charges. |
| How to interpret the cost figures: Installed-cost ranges are broad, planning-level U.S. estimates, not quotes. Costs depend on equipment configuration, number of ports, utility service capacity, transformer needs, permitting, trenching, construction, and local labor. A site assessment is needed for a reliable budget. | |||||
| Energy-cost example: The illustrative figure assumes an electricity price of $0.12 per kWh and 94% charging-system efficiency: $0.12 ÷ 0.94 ≈ $0.13 per delivered kWh. It excludes demand charges, fixed utility fees, taxes, network fees, maintenance, and retail pricing. Actual costs vary by tariff, location, and usage. | |||||
| 2026 buying takeaway: There is no universally best station. A 150 kW class unit is a reasonable starting point for many public charging sites, while lower- or higher-power equipment may be better depending on dwell time, traffic, vehicle capability, and available grid capacity. Compare total installed cost, expected utilization, warranty terms, service response, and verified uptime data before choosing. | |||||
„Thanks to the LUVIR technology, the solder resist process could be switched directly from the previously used mask exposure to direct exposure. As an outstanding digital solution on the market, this technology has been able to demonstrate fast process times and superior quality on our certified conventional ink in production. This allowed us to fully digitize the solder mask process at low cost – without process or ink adjustments. An excellent benefit to our production in Rot am See.“
Ralf Göhringer (Head of Production WE Rot am See)
I would definitely recommend the Limata machine and team for a future company purchase
Michael Greenaway
Compunetics Inc.
“The Limata ldi has been amazing!! Best thing we did was buy this machine”
Richard Brady
GM
Circuitlabs
“Since 2019, we have been running the Limata X1000 LDI system (including LUVIR for solder mask imaging) in daily production as an addition to our current process with film. The machine was capable of properly exposing Taiyo PSR-4000 BN (DI) solder mask types on normal to high-copper boards using a new and unique direct imaging process. The machine operating interface is very user friendly which allowed for a quick technical training curve. The pre-registration processing reduced several seconds of production time at every print. Limata support and service staff is incomparable. They supported our team every step of the way at basically any time of the day or night, with literally, an immediate response time, customizing the software interface to best fit our Operations and needs.
We have exposed more than 8,000 prints since end of October, on various solder mask colors and some resist film panels. Limata, has proven to be very capable and innovative. They are a strong contender in the industry.
We have very much enjoyed this project, and working with the team!
Thank you Limata for the continued support and being a part of our growth.”
Bill Sezate
Vice President, GM
Summit Interconnect
As a replacement to our current contact exposure process with film, the LIMATA X2000 system including LUVIR-Technology was capable of properly exposing non-LDI solder mask types using a direct imaging process. The machine offers cutting edge software with a very intuitive operating interface which allowed for quick technician training curve. The dual drawer system combined with pre-registration processing reduced several seconds of production time at every machine cycle. Limata support and service staff is world class. They added software patches to keep production running at shortest possible response times, customized the software interface to best fit our in-house Operations system, and even wrote a step-by-step machine processing manual. As a result of the project, we have exposed more than 16,000 times on various product types and solder mask brands/colors. Limata, in a very short timeframe as a company, has definitely shown they are truly innovative and will be challenging the industry of direct imaging for the top spot.
Kevin Beattie
Process Engineer
TTM Technologies
Forest Grove Division