Choosing the Best Mining Trucks in 2026 is not about chasing the biggest payload or newest dashboard. It is about matching a truck to the mine’s actual work. A haul road with sharp turns, steep grades, and loose rock places very different demands on a fleet than a wide, level route. The right choice affects tonnes moved, fuel use, tire life, maintenance hours, and operator fatigue.
Mining executive Mark Bristow has publicly emphasized disciplined, safe operations. Applying that principle to fleet selection, this guide uses a practical test: “Choose the truck that moves the required tonnes safely, reliably, and at a sustainable lifecycle cost.” This is a selection principle, not a verbatim quotation. Buyers should compare payload with cycle time, availability, service support, and site conditions. A truck that looks efficient on paper may lose that advantage when it waits for parts or struggles on a wet ramp.
The guide will examine diesel, trolley-assist, and battery-electric options, alongside automation readiness and total cost of ownership. It will also consider details that are easy to underestimate, such as turning radius, braking performance, cab visibility, and tire supply. No single model suits every mine. Even a careful comparison has limits; projected savings can shift with fuel prices, haul distance, and maintenance practice. Real operating data matters. So does a second look.
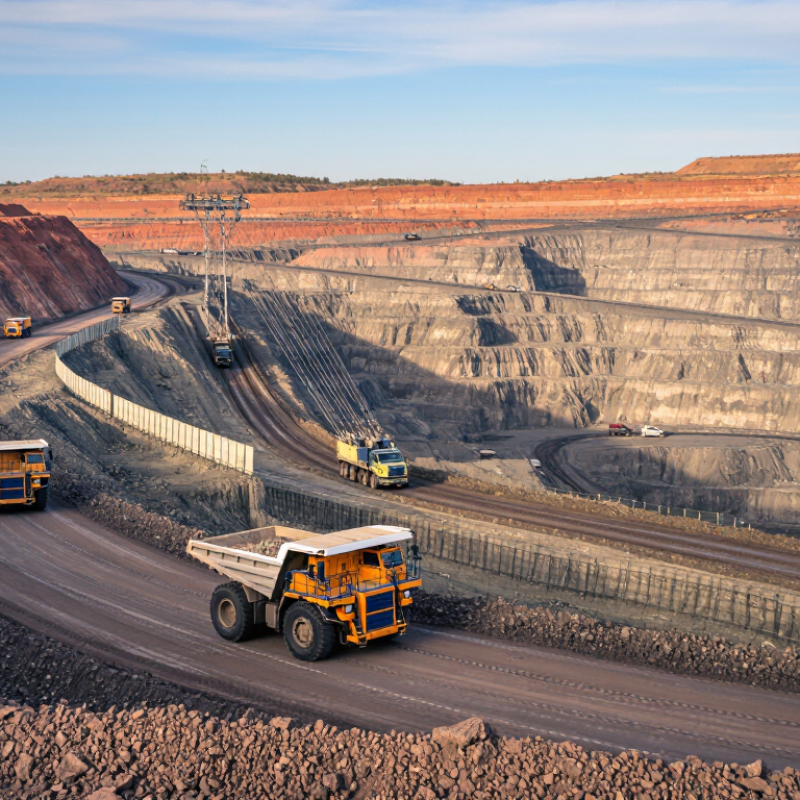
A 400-short-ton truck carries about 363 metric tonnes at its rated payload, but that figure alone is a poor selection rule. Start with the material: blasted rock, wet ore, and low-density overburden load differently by volume. Calculate typical and peak payloads from actual scale records, then check whether the body reaches its safe fill level before exceeding the truck’s rating. Numbers need context.
Compare trucks within this class using the mine’s haul profile, not brochure capacity alone. A long, steep ramp with sharp turns can reduce cycle efficiency and increase tire, brake, and road demands. Estimate loaded travel time, queueing, and dumping time across a representative shift; small delays matter when each load is enormous. Match the truck’s payload to shovel bucket size and pass count, since poor loading can cause both underloads and damaging overloads. Review payload-monitoring data after deployment, especially during wet-season changes. A spreadsheet may miss real variation, so leave room to revise assumptions. Also confirm that roads, bridges, maintenance bays, and recovery equipment can accommodate the truck’s dimensions and operating mass.
How to Choose the Best Mining Trucks in 2026?
When comparing two mining trucks rated at 400 short tons, treat capacity as a starting point, not a daily target. Rated payload does not guarantee that every haul reaches the same weight. Road grade, rolling resistance, material density, and loading accuracy all affect real output. A bucket of wet ore can change the load quickly.
Compare the full haul cycle. Check how each truck performs on your site’s longest climb, tightest turn, and roughest section of road. A truck may carry the rated load but lose productivity through slower cycle times or frequent maintenance stops. Review payload records, tire life, fuel or energy use, and parts access. Small differences add up. I would also question optimistic production estimates; actual shift conditions are rarely perfect.
Tips: Ask for site-specific performance data, not just brochure figures. Weigh representative loads, inspect haul roads, and compare availability over a full operating period. Leave room below rated capacity when loading conditions vary. It may feel conservative, but it can protect tires and reduce avoidable strain.
A truck fitted with 59/80R63 tires needs more than a wide haul road. Its tire envelope affects clearance, turning, and safe passing, while payload and speed influence road wear. Assess the complete truck-and-tire combination before setting road dimensions. Check curves, intersections, gradients, drainage, and subgrade strength under real operating conditions. A road that looks broad enough may still create tight turns or unstable edges.
Tips: Map the truck’s swept path on the narrowest curves. Measure clearances at loading areas and dump points. Ask qualified mine-road and tire specialists to review loaded and empty vehicle movements. Include berms, drainage channels, and maintenance equipment in the assessment. Small details matter.
Do not rely on a single width measurement. Repeated tire contact can loosen surfaces, and standing water can weaken the road beneath them. Review actual traffic patterns and inspect wear after operations begin. Then adjust the design where evidence points to a problem. This takes extra work. It can also reveal an uncomfortable truth: the planned route may not suit the chosen truck. Better to catch that before routine hauling makes the mismatch costly.
Choosing a mining truck starts with the work it must repeat, not its peak power rating. Map the duty cycle: loaded distance, empty return, gradients, road condition, payload, and time spent waiting. A short, steep route may reward strong low-speed torque and regenerative braking. Long, steady hauls can favor a different balance of engine efficiency, battery capacity, or charging access. Details matter.
Compare fuel use over a complete operating cycle. Include idle time, queuing, cold starts, and energy used on the return leg. Then calculate energy per tonne-kilometre: total energy consumed divided by payload moved and loaded distance. Keep the measurement boundary consistent across trucks. A lower figure can indicate better efficiency, but only if payload and route conditions are comparable. That matters.
Use dispatch records and fuel or charging data from representative shifts, not just catalogue estimates. Separate unusually wet roads or extended delays from normal operation, while keeping those difficult shifts in view. A tidy spreadsheet can still mislead if it hides changing payloads or empty running. Recheck the result after road repairs, seasonal changes, or route redesign. The “best” powertrain may change with the duty cycle, and the data will never be perfectly clean.
Compare representative powertrain energy intensity across common haul-duty cycles.
Lower values indicate less energy input per tonne moved over one kilometre. These are scenario-based planning estimates, not measured fleet results; actual consumption depends on payload, gradient, speed, road condition, and operating strategy. Energy is compared at the vehicle powertrain input, excluding upstream fuel and electricity production. For context, 0.16 MJ/t·km is approximately 4.5 litres of diesel per 1,000 tonne-kilometres, using diesel at 35.8 MJ/L.
A low purchase price does not guarantee low hauling costs. Compare mining trucks by cost per tonne across the same route, payload, and operating period. Use actual site records where possible; estimates can hide expensive assumptions. Keep the calculation simple and consistent.
Include tire purchases, repairs, retreading, and damage linked to road conditions. Track maintenance labor, parts, and scheduled service, then add the cost of lost production during downtime. Divide these costs, plus fuel and other operating expenses, by tonnes actually delivered—not theoretical capacity. Small gaps matter. A few extra tire failures on a rough ramp can shift the result more than a modest difference in initial price.
Availability also affects the denominator. A truck that is technically ready but waiting for parts is not moving tonnes. Record delays by cause, and check whether service teams can reach the machine quickly during night shifts or remote operations. Compare planned and unplanned downtime separately. Use site data. Review results over several months, since a short sample may miss seasonal road damage or major repairs. No spreadsheet removes uncertainty; some assumptions will still be wrong. Revisit them when operating conditions change.
„Thanks to the LUVIR technology, the solder resist process could be switched directly from the previously used mask exposure to direct exposure. As an outstanding digital solution on the market, this technology has been able to demonstrate fast process times and superior quality on our certified conventional ink in production. This allowed us to fully digitize the solder mask process at low cost – without process or ink adjustments. An excellent benefit to our production in Rot am See.“
Ralf Göhringer (Head of Production WE Rot am See)
I would definitely recommend the Limata machine and team for a future company purchase
Michael Greenaway
Compunetics Inc.
“The Limata ldi has been amazing!! Best thing we did was buy this machine”
Richard Brady
GM
Circuitlabs
“Since 2019, we have been running the Limata X1000 LDI system (including LUVIR for solder mask imaging) in daily production as an addition to our current process with film. The machine was capable of properly exposing Taiyo PSR-4000 BN (DI) solder mask types on normal to high-copper boards using a new and unique direct imaging process. The machine operating interface is very user friendly which allowed for a quick technical training curve. The pre-registration processing reduced several seconds of production time at every print. Limata support and service staff is incomparable. They supported our team every step of the way at basically any time of the day or night, with literally, an immediate response time, customizing the software interface to best fit our Operations and needs.
We have exposed more than 8,000 prints since end of October, on various solder mask colors and some resist film panels. Limata, has proven to be very capable and innovative. They are a strong contender in the industry.
We have very much enjoyed this project, and working with the team!
Thank you Limata for the continued support and being a part of our growth.”
Bill Sezate
Vice President, GM
Summit Interconnect
As a replacement to our current contact exposure process with film, the LIMATA X2000 system including LUVIR-Technology was capable of properly exposing non-LDI solder mask types using a direct imaging process. The machine offers cutting edge software with a very intuitive operating interface which allowed for quick technician training curve. The dual drawer system combined with pre-registration processing reduced several seconds of production time at every machine cycle. Limata support and service staff is world class. They added software patches to keep production running at shortest possible response times, customized the software interface to best fit our in-house Operations system, and even wrote a step-by-step machine processing manual. As a result of the project, we have exposed more than 16,000 times on various product types and solder mask brands/colors. Limata, in a very short timeframe as a company, has definitely shown they are truly innovative and will be challenging the industry of direct imaging for the top spot.
Kevin Beattie
Process Engineer
TTM Technologies
Forest Grove Division