Choosing a Laboratory Spectrometer starts with the measurement, not the product catalog. Identify the samples you will analyze, the signals you need to detect, and the decisions the results must support. A spectrometer used to compare solution absorbance may need different capabilities from one measuring emission or material reflectance. The sample sets the terms.
Check wavelength range, spectral resolution, sensitivity, and measurement speed against your actual work. A narrow feature can disappear if resolution is insufficient, while a broad range may add cost without improving your results. Details matter. Also consider sample holders, available accessories, software, and whether the instrument fits your bench and workflow. Ask how calibration is handled and what support is available if performance changes. These practical points are easy to miss when specifications dominate the discussion.
A reliable choice depends on more than a headline accuracy figure. Review test conditions, data outputs, maintenance needs, and the manufacturer’s documentation. If possible, assess representative samples under realistic laboratory conditions; results from a demonstration may not match your own setup. Not always. Budget for installation, training, consumables, and service, not just the instrument itself. There may be trade-offs: higher sensitivity can come with greater cost or stricter operating requirements. This guide explains how to compare those factors, ask useful questions, and select a spectrometer suited to your samples and purpose. A little uncertainty is normal; the goal is to make it visible before purchase.
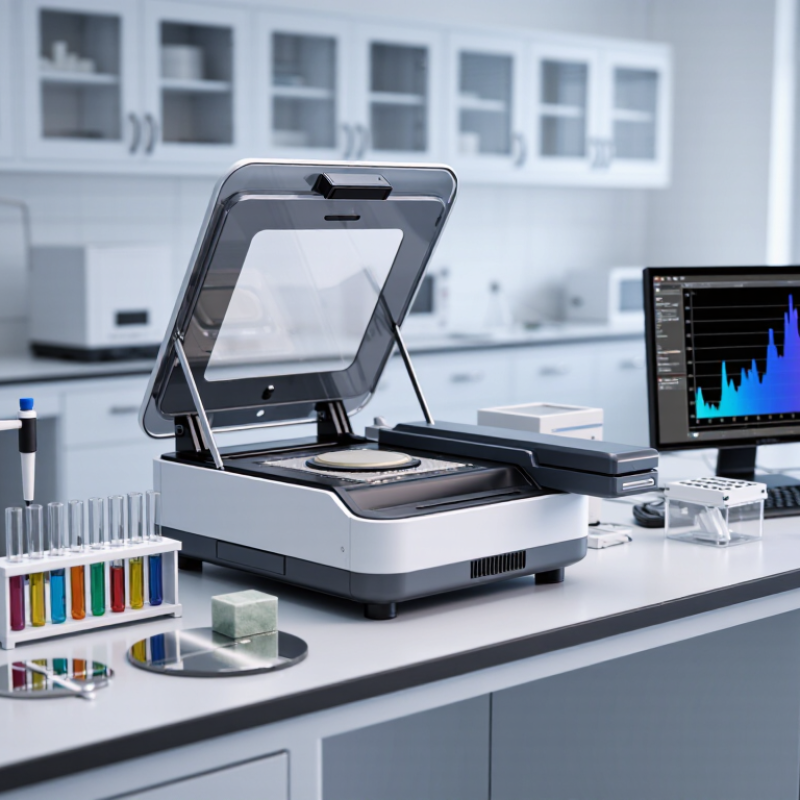
Define the decision the measurement must support: identify a material, quantify a component, or track a process change. Then list the analytes, expected concentration range, and required detection limit. These goals determine useful wavelength coverage, resolution, sensitivity, and detector range. For example, EPA SW-846 Method 6010D (2014) lists ICP-OES analytical lines from 167.079 to 766.491 nm. That range is specific to this method, not a universal instrument requirement. Check whether your target elements have suitable lines within the instrument’s usable range.
Describe the samples as they will reach the laboratory. A clear liquid, a cloudy suspension, and a polished solid can demand different sampling accessories and preparation. Note sample size, physical state, solvent, temperature, likely interferents, and whether measurements must be non-destructive. Details matter. A reflective surface may need a different geometry from a transmission measurement through a cuvette. Ask how the instrument handles blanks, replicate readings, and calibration standards; these affect whether results are comparable. I would also record what is still uncertain, such as concentration or matrix variation, rather than choosing specifications from a neat sample alone. A small pilot test can expose assumptions that the written requirements missed.
Choose the spectroscopic technique by defining the decision your measurement must support. Raman can identify molecular fingerprints in small, solid samples, while infrared spectroscopy is useful for checking functional groups in powders or films. UV-Vis spectroscopy suits concentration measurements in clear liquids, but cloudy samples can scatter light and distort results. For elemental composition, X-ray fluorescence offers rapid screening of solids; ICP-OES is better suited to solutions and multi-element measurements. These are not interchangeable tools. Not even close.
Match the instrument to the sample, detection limit, and daily workload. A shiny alloy, a dilute water sample, and a polymer film demand different preparation and measurement conditions. The USGS Mineral Commodity Summaries 2024 estimated global lithium mine production at 180,000 metric tons in 2023, up from 146,000 in 2022. That growth highlights why battery-material workflows need dependable elemental checks, though production figures alone do not dictate instrument choice. Ask vendors for application-specific validation data, including repeatability, detection limits, and performance on your actual sample matrix. A detail often missed: sample preparation can contribute more variation than the spectrometer itself. Test that assumption before purchasing.
Choosing a laboratory spectrometer starts with the wavelengths your samples actually use, not the widest range on a specification sheet. For UV-visible work, confirm that the instrument covers the expected absorption bands. Emission or near-infrared measurements may require different optics. Leave room at both ends of the range. A band near an instrument’s edge may be harder to measure reliably.
Tips: List the analyte, solvent, sample type, and weakest expected signal. Ask for performance data under similar conditions, including slit width and integration time.
Resolution describes how well nearby spectral features remain distinct. If two peaks sit close together, check resolution in nanometers at the wavelength of interest. Finer resolution can help, but may reduce the light reaching the detector. Sensitivity concerns how clearly a weak signal rises above noise. Compare signal-to-noise ratios or detection limits using conditions close to your actual samples. Longer integration can improve weak readings, though it slows measurements and may expose drift. Specifications rarely capture every sample-matrix effect, so a small pilot measurement can reveal assumptions worth revisiting.
A spectrometer should fit the sample, not the other way around. Check whether it measures liquids, powders, films, or gases, and whether the sample needs transmission, reflection, or fluorescence analysis. A cloudy liquid may scatter light, while a thin film can demand a different holder and optical path. Confirm the instrument’s wavelength range against the signals your method actually needs. Extra range sounds useful, but it cannot compensate for a poorly matched sampling setup.
For UV–Vis work, NIST’s certificate data for Standard Reference Material 2034 lists holmium oxide wavelength peaks at 279.3 nm and 637.5 nm. These certified points can help verify wavelength performance across part of the instrument’s range. Check that the reference material and sample are compatible with the chosen cell, solvent, and measurement geometry. Small details matter. A scratched cuvette or bubbles near the beam can distort readings.
Laboratory conditions deserve equal attention. ISO/IEC 17025:2017 calls for environmental conditions to be suitable, monitored, and controlled when they can affect results. Temperature shifts may change sample behavior; dust, vibration, and stray light can also disrupt measurements. Note the room’s temperature range, humidity, bench stability, and available power before installation. Be honest about limitations: a stable room does not guarantee stable samples. Record conditions during method validation, and repeat checks when the setup changes.
Compare typical wavelength coverage with the sample’s measurement needs. Actual ranges depend on the instrument configuration.
Before selecting a system, check whether the sample is solid, liquid, or gas; whether it transmits or scatters light; and whether its solvent, container, or substrate absorbs in the required region. Also consider laboratory temperature, humidity, vibration, available space, and the instrument’s source and detector requirements.
When choosing a laboratory spectrometer, evaluate the software as carefully as the optical specifications. Can staff create methods, review spectra, and export results without repeated manual steps? Run a trial with a representative sample. Watch how the software handles noisy baselines, batch measurements, and failed scans. Convenience matters. A polished demonstration may hide awkward steps, so test a difficult sample from your routine workflow.
Ask what training, response times, and instrument checks are included after installation. Confirm whether service visits, replacement lamps, detector components, and software updates carry extra fees. Compare costs over five years, not just the purchase price; downtime can quietly consume staff hours. Request a written estimate. Estimates can still miss surprises.
Tips: Keep a simple ownership worksheet. Record annual service, consumables, training, calibration, and expected downtime. Ask nearby labs how quickly support resolves ordinary faults, not only major failures. Test it live. A low-cost system may prove expensive if only one trained person can operate it confidently.
„Thanks to the LUVIR technology, the solder resist process could be switched directly from the previously used mask exposure to direct exposure. As an outstanding digital solution on the market, this technology has been able to demonstrate fast process times and superior quality on our certified conventional ink in production. This allowed us to fully digitize the solder mask process at low cost – without process or ink adjustments. An excellent benefit to our production in Rot am See.“
Ralf Göhringer (Head of Production WE Rot am See)
I would definitely recommend the Limata machine and team for a future company purchase
Michael Greenaway
Compunetics Inc.
“The Limata ldi has been amazing!! Best thing we did was buy this machine”
Richard Brady
GM
Circuitlabs
“Since 2019, we have been running the Limata X1000 LDI system (including LUVIR for solder mask imaging) in daily production as an addition to our current process with film. The machine was capable of properly exposing Taiyo PSR-4000 BN (DI) solder mask types on normal to high-copper boards using a new and unique direct imaging process. The machine operating interface is very user friendly which allowed for a quick technical training curve. The pre-registration processing reduced several seconds of production time at every print. Limata support and service staff is incomparable. They supported our team every step of the way at basically any time of the day or night, with literally, an immediate response time, customizing the software interface to best fit our Operations and needs.
We have exposed more than 8,000 prints since end of October, on various solder mask colors and some resist film panels. Limata, has proven to be very capable and innovative. They are a strong contender in the industry.
We have very much enjoyed this project, and working with the team!
Thank you Limata for the continued support and being a part of our growth.”
Bill Sezate
Vice President, GM
Summit Interconnect
As a replacement to our current contact exposure process with film, the LIMATA X2000 system including LUVIR-Technology was capable of properly exposing non-LDI solder mask types using a direct imaging process. The machine offers cutting edge software with a very intuitive operating interface which allowed for quick technician training curve. The dual drawer system combined with pre-registration processing reduced several seconds of production time at every machine cycle. Limata support and service staff is world class. They added software patches to keep production running at shortest possible response times, customized the software interface to best fit our in-house Operations system, and even wrote a step-by-step machine processing manual. As a result of the project, we have exposed more than 16,000 times on various product types and solder mask brands/colors. Limata, in a very short timeframe as a company, has definitely shown they are truly innovative and will be challenging the industry of direct imaging for the top spot.
Kevin Beattie
Process Engineer
TTM Technologies
Forest Grove Division