Reading an Lcd Tv Circuit Diagram turns a confusing television chassis into a traceable system. Each line can represent power, data, grounding, or a control signal. A wrong interpretation may lead to a replaced board that was never defective. That mistake is common, and worth admitting.
Omdia’s TV Display & OEM Intelligence Service reported global television shipments above 200 million units in 2023. This scale reflects a large installed base requiring accurate diagnosis, not guesswork. LCD televisions combine timing controllers, power boards, LED drivers, mainboards, and panel interfaces. The diagram connects these sections through symbols, voltage labels, test points, and connector numbers. Electronics author John D. Lenk expressed this practical idea: “The schematic is the technician’s roadmap.” His statement remains useful when a backlight connector looks identical to a signal connector.
This guide explains how to read an Lcd Tv Circuit Diagram from left to right and from power input to display output. You will learn how to identify blocks, follow voltage rails, interpret ground symbols, and compare expected measurements. A multimeter can confirm a missing 12-volt rail, but it cannot replace careful reasoning. Some diagrams are incomplete. Others use manufacturer-specific abbreviations. Even experienced technicians can misread a page.
Safety must remain part of the method. Power supply capacitors may retain dangerous charge after unplugging. Use approved procedures, insulated probes, and service documentation. The goal is not simply finding a failed component. It is building a reliable explanation for why the screen stays dark, flickers, or shows sound without an image.
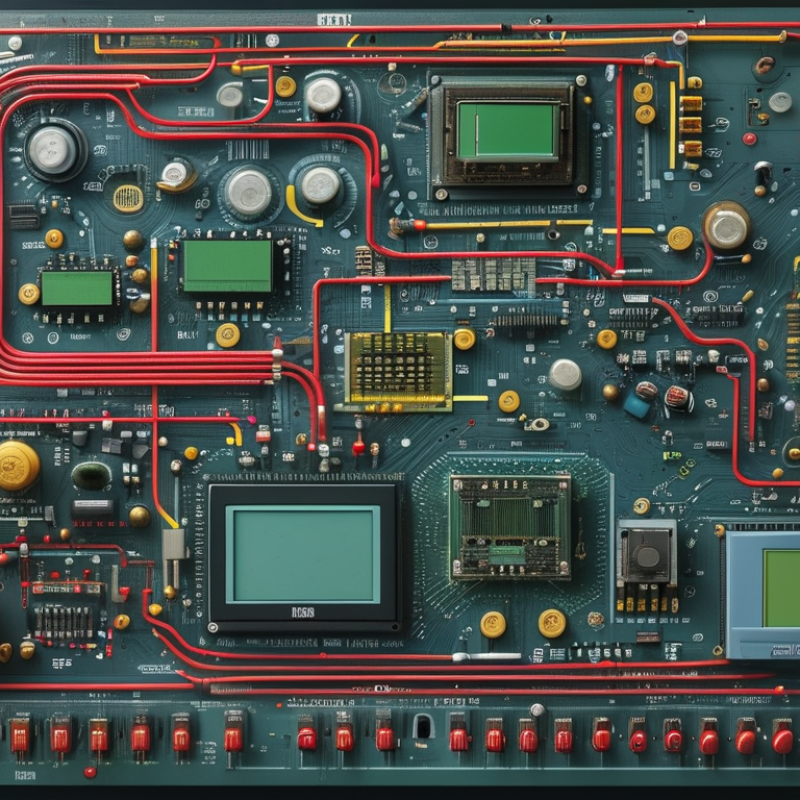
How to Read an LCD TV Circuit Diagram?
When I read an LCD TV circuit diagram, I mark the main sections before tracing any signal. The power supply section usually sits near the AC input. It contains fuses, filters, rectifiers, switching devices, and voltage regulators. Look for labels such as standby voltage, main voltage, and backlight output. These labels reveal the circuit’s operating stages.
Next, locate the main board. It processes video, audio, control commands, and external input signals. The timing controller, or T-con section, connects the main board with the display panel. It sends precise data through flat cables. Short lines matter. A loose cable can imitate a serious board failure. The backlight driver section controls LED current and brightness. Its output may reach a high voltage, even when the screen appears dark.
The audio section often includes an amplifier, speakers, and mute control lines. The remote receiver and button panel usually connect to the main board through low-voltage circuits. I compare each printed label with the schematic revision, because similar diagrams may use different connector numbers. I have misread a standby line as a power rail before. That mistake caused unnecessary testing. Always check ground symbols and voltage test points with a reliable meter. Never assume every connector pin carries the same type of signal. Trace the circuit slowly from input to output.
Trace power from the input connector, not from the screen. The mains cable enters the power board, where a fuse, filter, rectifier, and switching section appear in sequence. After rectification, the primary capacitor may hold several hundred volts. Disconnect power and verify discharge before probing. The circuit diagram usually marks this path with labels such as AC, HV, DC, or GND.
Follow each output rail toward its destination. A common rail feeds the main board, while separate converters supply the LED driver, audio section, and control circuits. Check the printed voltage beside every connector. For example, a 12-volt rail may enter the main board, then become 5 volts and 3.3 volts through local regulators. A missing rail narrows the fault quickly. I once blamed a regulator, but a cracked solder joint caused the interruption.
Power tracing also explains energy use. The U.S. Energy Information Administration’s 2020 Residential Energy Consumption Survey found televisions in about 96% of American homes. The International Energy Agency’s Energy Efficiency 2024 report estimates buildings consume roughly 30% of global final energy. Small standby losses therefore matter across millions of devices. Compare the diagram with measured voltage, ripple, and ground continuity. Do not trust color alone. Some diagrams simplify return paths, and that can mislead even experienced technicians.
How to Read an LCD TV Circuit Diagram?
Reading an LCD TV circuit diagram becomes easier when you follow the signal path. Start at the external input connector, such as HDMI, composite video, or an antenna terminal. Trace each line toward the main processing board. Small protection components may appear near the connector. They can include filters, resistors, and surge protection devices.
Watch the labels closely. A digital input may pass through a receiver before reaching the video processor. The processor decodes the signal, adjusts resolution, and sends image data through an LVDS or eDP link. That connection usually leads to the timing controller, often marked as a T-con section. From there, row and column signals travel toward the display panel. The backlight path is separate. It normally includes a power converter, driver circuit, and multiple LED outputs.
Use the diagram with the physical board beside you. Connector numbers, ground symbols, and test points help prevent mistakes. I usually mark the signal route with a pencil while checking continuity with power removed. Never assume an identical connector carries identical signals. Diagrams can contain revisions, and some labels may be unclear. That is where careful measurement matters. An oscilloscope can confirm clock activity, while a multimeter can check supply rails and grounds. Be cautious around charged capacitors and high-voltage backlight circuits. My own tracing is not perfect; I sometimes follow a control line as if it were video data. Rechecking the block diagram usually exposes that error.
Follow the signal path from the external input through the receiver, decoder, scaler, and timing controller before it reaches the display panel. The chart shows the uncompressed active-video data rate for common RGB 4:4:4 formats at 60 Hz.
An LCD TV circuit diagram becomes clearer when you recognize its symbols first. Resistors usually appear as zigzag lines or rectangular blocks. Capacitors look like two parallel plates. Diodes often have a triangle-like marking or a clear bar symbol, depending on the diagram standard. Integrated circuits appear as rectangular blocks with numbered pins. Connectors are commonly shown as small labeled terminals.
I usually trace power from the input section toward the display and control circuits. This helps reveal how voltage moves through fuses, coils, rectifiers, and regulators. A transformer symbol may indicate isolation or voltage conversion. Ground symbols matter too. They show reference points, not always physical earth connections. Read the nearby labels carefully, because “GND,” “VCC,” and “BL_ON” can describe different circuit functions. My early mistake was assuming every ground symbol had the same purpose.
Tips: Keep the diagram beside the circuit board. Match connector numbers before testing anything. Use a meter only with proper training, especially around high-voltage sections. Highlight each symbol as you identify it. Do not trust color alone; printed labels are more reliable. Some diagrams are poorly scanned or simplified, so one symbol may need confirmation from its surrounding circuit. Record your observations, even if they seem obvious. That habit prevents repeated errors.
How to Read an LCD TV Circuit Diagram?
Reading an LCD TV circuit diagram becomes easier when voltage markings guide your attention. Start at the power input, then follow each labeled rail toward the main board, timing section, and panel. A marking such as 12V, 5V, or 3.3V shows the expected DC level at a specific point. It does not guarantee that voltage exists during every operating condition. Standby and active modes can produce different readings.
Test points provide practical checkpoints for circuit analysis. Use the circuit ground shown in the diagram, not a random metal surface. Set your multimeter to the correct DC range before measuring. Compare the measured value with the printed specification and note any large difference. A missing 12V rail may indicate a power fault, while a correct rail with no display signal suggests another section needs attention. I still recheck probe placement, because one careless touch can create a misleading result.
Tips: Disconnect power before resistance tests. Discharge capacitors safely. Never probe the mains section unless properly trained. Record each reading with the TV’s operating mode and temperature. Printed values can be incomplete or outdated, so confirm them against the board layout and service documentation. A diagram is a map, not absolute truth.
„Thanks to the LUVIR technology, the solder resist process could be switched directly from the previously used mask exposure to direct exposure. As an outstanding digital solution on the market, this technology has been able to demonstrate fast process times and superior quality on our certified conventional ink in production. This allowed us to fully digitize the solder mask process at low cost – without process or ink adjustments. An excellent benefit to our production in Rot am See.“
Ralf Göhringer (Head of Production WE Rot am See)
I would definitely recommend the Limata machine and team for a future company purchase
Michael Greenaway
Compunetics Inc.
“The Limata ldi has been amazing!! Best thing we did was buy this machine”
Richard Brady
GM
Circuitlabs
“Since 2019, we have been running the Limata X1000 LDI system (including LUVIR for solder mask imaging) in daily production as an addition to our current process with film. The machine was capable of properly exposing Taiyo PSR-4000 BN (DI) solder mask types on normal to high-copper boards using a new and unique direct imaging process. The machine operating interface is very user friendly which allowed for a quick technical training curve. The pre-registration processing reduced several seconds of production time at every print. Limata support and service staff is incomparable. They supported our team every step of the way at basically any time of the day or night, with literally, an immediate response time, customizing the software interface to best fit our Operations and needs.
We have exposed more than 8,000 prints since end of October, on various solder mask colors and some resist film panels. Limata, has proven to be very capable and innovative. They are a strong contender in the industry.
We have very much enjoyed this project, and working with the team!
Thank you Limata for the continued support and being a part of our growth.”
Bill Sezate
Vice President, GM
Summit Interconnect
As a replacement to our current contact exposure process with film, the LIMATA X2000 system including LUVIR-Technology was capable of properly exposing non-LDI solder mask types using a direct imaging process. The machine offers cutting edge software with a very intuitive operating interface which allowed for quick technician training curve. The dual drawer system combined with pre-registration processing reduced several seconds of production time at every machine cycle. Limata support and service staff is world class. They added software patches to keep production running at shortest possible response times, customized the software interface to best fit our in-house Operations system, and even wrote a step-by-step machine processing manual. As a result of the project, we have exposed more than 16,000 times on various product types and solder mask brands/colors. Limata, in a very short timeframe as a company, has definitely shown they are truly innovative and will be challenging the industry of direct imaging for the top spot.
Kevin Beattie
Process Engineer
TTM Technologies
Forest Grove Division