Carbon Filters can improve water or air quality, but no single cartridge removes every unwanted substance. The right choice depends on what enters the system, how much flows through it, and how often the filter can be replaced. A tap-water cartridge, for example, may target chlorine taste and odor; a whole-house unit faces different flow demands. Details matter.
Water-quality expert Dr. Joseph Cotruvo has written extensively about drinking-water treatment and contaminant-specific performance. A practical principle consistent with that work is: “Choose treatment for the contaminant, not the label.” This is an editorial summary, not a verbatim quotation. It captures a common selection mistake: trusting broad claims without checking test data or certification. Look for the named contaminant, the rated capacity, and the flow rate. Then check whether the filter has been tested against a recognized standard relevant to its use.
Small checks help. Read the replacement schedule. Confirm the cartridge fits your housing. Notice whether the manufacturer explains what the filter does not remove. A filter may perform well at first, then lose effectiveness as its media fills. That part is easy to overlook.
The guide below presents ten practical tips for comparing Carbon Filters, from media type and pore structure to maintenance costs and supplier transparency. Not every detail has a tidy answer; water quality varies, and product claims can be uneven. A careful choice starts with a water test or a clearly defined treatment goal.
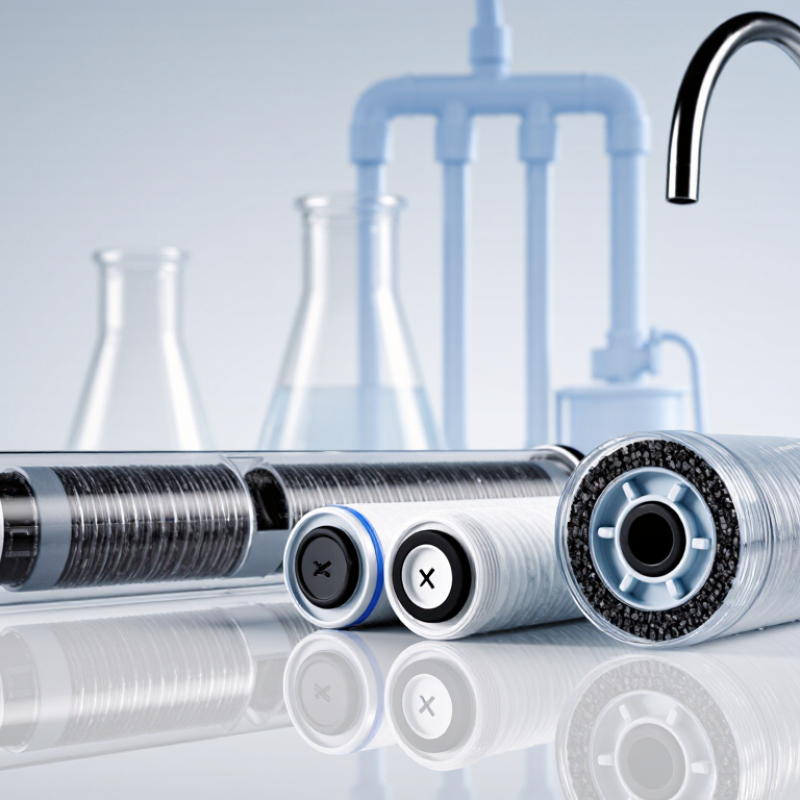
EPA drinking-water standards help turn “carbon filter” from a broad label into a specific choice. Check your utility’s Consumer Confidence Report for contaminants detected in your supply and compare reported levels with EPA limits. A limit is a benchmark, not proof that a particular filter will remove that substance. Taste is not enough.
Look for the exact contaminant name in a filter’s independent certification and performance data. Activated carbon can reduce chlorine taste and odor, and some certified models reduce particular volatile organic compounds or other listed contaminants. But performance varies by product. A claim about one contaminant does not apply to all contaminants. Standards are a map, not a filter promise.
The report may feel dense, and it is easy to misread a table. Ask your water utility to clarify unfamiliar entries. If you use a private well, arrange testing through a qualified laboratory; public-water reports do not cover it. Then match test results to a filter’s verified reduction claims, such as applicable NSF/ANSI certifications. Carbon generally does not remove every dissolved mineral or reliably disinfect water. Check replacement intervals, too: an overdue cartridge can undermine the performance you expected.
Choosing between granular activated carbon and carbon block starts with the flow your system must deliver. Granular carbon usually offers less resistance, making it useful where water demand is higher. Carbon block packs carbon more tightly, which can improve contact with the media but may reduce flow and increase pressure drop. Neither format is automatically better.
Check the filter’s rated flow and pressure range, then compare them with your actual use. A kitchen tap may need a steady stream; a whole-house system faces several fixtures running at once.
Watch what happens when the cartridge is partly loaded, too. Real conditions are rarely ideal. If flow falls sharply, a tighter block may be frustrating; if water moves too quickly through granular media, treatment performance can suffer. A sediment prefilter can help protect either type from particles, though it adds another component to maintain.
Ask for test data tied to the contaminants you need to reduce, not just a broad claim about “better filtration.” Small details matter.
I would also leave a margin rather than sizing the filter exactly to peak demand. That judgment is imperfect, but it can prevent a system that looks fine on paper from feeling slow at the faucet.
When comparing carbon filters, read the ASTM D4607 iodine number alongside BET surface area, not as competing scores. Iodine number, usually reported in mg/g, estimates how much iodine a carbon adsorbs under a defined laboratory procedure. ASTM D4607 standardizes this test, supporting more consistent comparisons when samples are prepared and tested alike. It can indicate accessible microporosity, but it does not predict removal of every contaminant.
BET surface area, reported in m²/g, estimates gas-accessible area from adsorption data, commonly using nitrogen. A higher value may mean more exposed surface, but pore size and surface chemistry also matter. Not automatically. Large molecules may not fit narrow pores, while water and competing compounds can occupy useful sites. BET results depend on sample preparation and model assumptions. Compare like with like.
Ask for both figures, the test methods, and lot-specific data. Then match them to the intended water or air stream. Check flow rate, contact time, humidity, and test results for the actual contaminant. Two carbons can have similar iodine numbers yet perform differently in a working filter. I’d treat any single-number ranking cautiously; field conditions are messier than the lab, and that uncertainty deserves attention.
Compare ASTM D4607 iodine numbers and BET surface area (m²/g)
The bars show approximate representative values, not product specifications; actual results vary by feedstock, activation, particle size, and test conditions. ASTM D4607 iodine number (mg/g) and BET surface area (m²/g) are different measurements, so compare each metric on its own axis and check the filter’s intended contaminant and certified test data.
A carbon filter’s label should name the exact standard and reduction claim, not just say “certified.” NSF/ANSI 42 covers aesthetic effects, such as chlorine taste and odor; NSF/ANSI 53 addresses specific health-related contaminants. NSF/ANSI 401 covers up to 15 emerging or incidental contaminants, but “up to” does not mean every certified filter reduces all 15. Check the model’s listing and its individual claims. Small print matters.
The U.S. EPA’s Fifth Unregulated Contaminant Monitoring Rule (UCMR 5) requires roughly 10,000 public water systems to monitor 29 PFAS and lithium. That monitoring scope is a useful reminder: contaminant concerns vary, so a broad standard number alone cannot tell you what a cartridge removes. Compare the certification listing with your water report, then check stated flow rate and cartridge capacity. A filter may meet a claim only under specified test conditions. Paperwork can feel tedious. Still, it is worth checking before water runs through a new cartridge, especially when the label highlights “401” but names no contaminants.
A carbon filter’s rated capacity is the volume of water it is expected to treat under stated test conditions. It is not a promise that every household will get the same results. Check the test report for the water flow rate, contaminant tested, and replacement point. A filter tested at a slow flow may perform differently at a busy kitchen tap. That matters.
Compare the capacity claim with the recommended replacement interval. If a cartridge is rated for 1,000 gallons, estimate your household’s daily use to see how quickly you might reach that limit. But do not rely on the calendar alone. Sediment, water quality, and changes in taste or flow can affect performance. Real use varies. A clear-looking filter can still be near its rated limit.
Look for test results tied to a recognized protocol, with the specific contaminant and reduction level clearly stated. Broad phrases such as “long-lasting” offer little practical guidance without those details. Keep a simple log of installation dates and approximate use; it is imperfect, but better than guessing. If your household’s water differs from the test conditions, treat the published interval as an estimate, not a guarantee. Sometimes the fine print is more useful than the headline claim.
„Thanks to the LUVIR technology, the solder resist process could be switched directly from the previously used mask exposure to direct exposure. As an outstanding digital solution on the market, this technology has been able to demonstrate fast process times and superior quality on our certified conventional ink in production. This allowed us to fully digitize the solder mask process at low cost – without process or ink adjustments. An excellent benefit to our production in Rot am See.“
Ralf Göhringer (Head of Production WE Rot am See)
I would definitely recommend the Limata machine and team for a future company purchase
Michael Greenaway
Compunetics Inc.
“The Limata ldi has been amazing!! Best thing we did was buy this machine”
Richard Brady
GM
Circuitlabs
“Since 2019, we have been running the Limata X1000 LDI system (including LUVIR for solder mask imaging) in daily production as an addition to our current process with film. The machine was capable of properly exposing Taiyo PSR-4000 BN (DI) solder mask types on normal to high-copper boards using a new and unique direct imaging process. The machine operating interface is very user friendly which allowed for a quick technical training curve. The pre-registration processing reduced several seconds of production time at every print. Limata support and service staff is incomparable. They supported our team every step of the way at basically any time of the day or night, with literally, an immediate response time, customizing the software interface to best fit our Operations and needs.
We have exposed more than 8,000 prints since end of October, on various solder mask colors and some resist film panels. Limata, has proven to be very capable and innovative. They are a strong contender in the industry.
We have very much enjoyed this project, and working with the team!
Thank you Limata for the continued support and being a part of our growth.”
Bill Sezate
Vice President, GM
Summit Interconnect
As a replacement to our current contact exposure process with film, the LIMATA X2000 system including LUVIR-Technology was capable of properly exposing non-LDI solder mask types using a direct imaging process. The machine offers cutting edge software with a very intuitive operating interface which allowed for quick technician training curve. The dual drawer system combined with pre-registration processing reduced several seconds of production time at every machine cycle. Limata support and service staff is world class. They added software patches to keep production running at shortest possible response times, customized the software interface to best fit our in-house Operations system, and even wrote a step-by-step machine processing manual. As a result of the project, we have exposed more than 16,000 times on various product types and solder mask brands/colors. Limata, in a very short timeframe as a company, has definitely shown they are truly innovative and will be challenging the industry of direct imaging for the top spot.
Kevin Beattie
Process Engineer
TTM Technologies
Forest Grove Division