Turbidity affects how water looks and how reliably a treatment process can be monitored. A Turbidity Sensor measures suspended particles by detecting how they scatter or absorb light. In a treatment plant, that reading can help operators spot a sudden change after filtration. In a river, it can show how sediment shifts after heavy rain. The measurement is useful, but only when the instrument suits the site and its operating conditions.
China’s sensor industry includes manufacturers serving water utilities, environmental monitoring projects, laboratories, and industrial plants. This guide introduces ten companies and offers a practical starting point for comparing their products. It considers factors such as measurement range, optical design, installation options, calibration needs, technical documentation, and after-sales support. Product specifications are worth checking closely. A compact probe may fit a narrow pipe, while a submersible model may be better suited to an open channel. Details matter.
There is no universal best choice. Catalog figures do not always tell the full story, and real-world readings can be affected by bubbles, color, fouling, or uneven flow. Buyers should confirm performance claims with current manufacturer documentation and, when possible, application-specific testing. That extra step takes time. It can prevent a mismatch between a sensor’s stated capabilities and the conditions at the actual monitoring point. This overview aims to inform comparison, not replace technical evaluation.
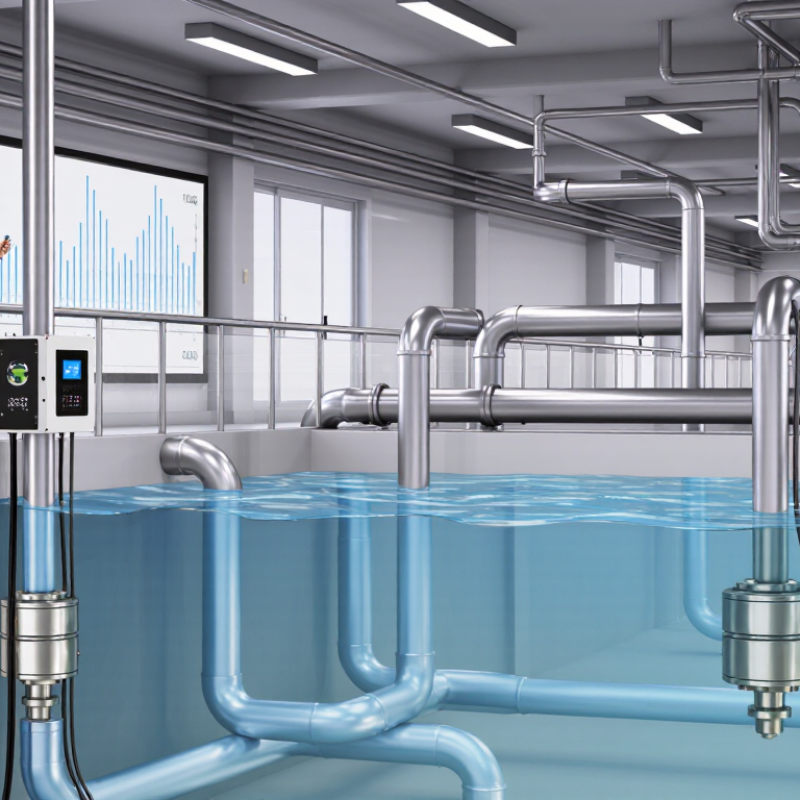
A turbidity sensor estimates how cloudy water is by measuring how particles affect light. Tiny suspended materials, such as silt, algae, or organic debris, scatter or absorb light as it passes through a sample. Many sensors shine light into the water and detect scattered light at an angle, often 90 degrees. Others measure how much light travels straight through. Readings are commonly reported in NTU or FNU, depending on the instrument’s optical method. These values describe clarity, not the identity or safety of the particles.
In field use, bubbles, dirty optics, changing sample color, and deposits on the sensor can shift readings. A sudden spike may reflect real runoff—or simply a trapped air bubble. Small changes matter. Compare readings with a clean, calibrated instrument and note water temperature and sampling conditions. Turbidity can help track treatment or sediment movement, but it cannot identify a contaminant by itself. That distinction is easy to overlook.
Tips: Keep the sensing window clean, avoid bubbles during sampling, and calibrate with suitable standards at the recommended intervals. Record maintenance beside each measurement. If readings seem inconsistent, inspect the sensor and repeat the test before interpreting the result. Field conditions are messy, and even careful checks may not explain every unusual reading.
When assessing turbidity sensor manufacturers, start with measurement performance, not brochure claims. Ask for calibration records, repeatability data, detection range, and response time under changing water conditions. ISO 7027-1:2016 describes standardized methods for measuring turbidity; a credible supplier should explain which method its instrument follows. Check whether readings remain stable when samples contain fine bubbles or suspended particles. Small details matter.
Next, examine whether the sensor suits your actual process. EPA’s Surface Water Treatment Rule sets a benchmark for filtered water: conventional and direct filtration systems must meet 0.3 NTU in at least 95% of monthly measurements, with no measurement above 1 NTU. These thresholds make low-range accuracy and dependable alarms practical selection criteria, not optional extras. Review the manufacturer’s test data near your operating limits. Ask about wiper performance, window fouling, replacement parts, and technical support. WHO’s Guidelines for Drinking-water Quality also emphasize turbidity’s role in treatment and disinfection monitoring. Still, a published specification cannot prove long-term field reliability. Request references from comparable installations, and verify maintenance needs with operators. Sometimes the best sensor is simply the one your team can keep clean and calibrated.
China’s turbidity sensor manufacturers serve water treatment, industrial process monitoring, and environmental testing. These ten profiles offer a practical way to compare their products and technical capabilities without treating every supplier as interchangeable. A sensor installed in a clear laboratory sample may behave differently in wastewater with suspended solids or changing temperatures.
When reviewing a manufacturer, look beyond the measurement range. Check whether the probe supports the required installation method, signal output, cleaning routine, and calibration process. Ask how often calibration is recommended and whether replacement parts are readily available. Small details matter. A difficult-to-clean optical window can affect readings during routine operation.
The profiles also help buyers assess technical support and documentation, including manuals, test procedures, and guidance for commissioning. Product descriptions alone cannot confirm performance in a specific process. Request test data relevant to your water conditions, and compare it with your own requirements. Some specifications may look impressive on paper; real operating conditions deserve a closer look.
Manufacturers in China’s turbidity-sensor sector serve needs ranging from field checks to continuous process control. Their product lines commonly include portable meters, benchtop analyzers, inline probes, and systems with automatic cleaning. Municipal water plants use inline sensors to track raw-water changes and filter performance. Wastewater facilities monitor treatment stages and discharge quality. Food and beverage processors, pharmaceutical plants, paper mills, mines, and aquaculture operations also use turbidity measurements to manage water clarity and production consistency.
Performance requirements depend on the application. The U.S. EPA Surface Water Treatment Rules set a benchmark for conventional and direct filtration: combined filter effluent must be at or below 0.3 NTU in at least 95% of monthly measurements, and must not exceed 1 NTU. The World Health Organization’s Guidelines for Drinking-water Quality note that turbidity below 1 NTU supports effective disinfection. These figures explain why buyers compare measuring range, accuracy, response time, and calibration needs—not just price.
Not every site is tidy. Bubbles, deposits, and changing sample flow can distort readings, so cleaning design and installation details matter. Procurement teams should verify performance under their actual water conditions and review maintenance records before selecting equipment.
China Top 10 Turbidity Sensor Manufacturers: How to Compare Manufacturers for Your Monitoring Needs
A useful comparison starts with the water, not the catalog. Check whether the stated measurement range fits your expected turbidity, from clear treated water to sediment-heavy process streams. Ask how the sensor performs near the low end, where small differences can matter. That detail matters. Also confirm whether readings are reported in NTU or another unit, and whether the calibration method suits your procedures.
Look beyond the sensing element. Compare wetted materials, cable length, connector type, and protection ratings against the actual installation site. A river intake with leaves and grit may need a cleaning wiper; a sheltered tank may not. Ask about response time, temperature limits, output options, and compatibility with your data logger. Request calibration records and clear maintenance intervals. Vague answers are worth noticing.
Support can shape long-term costs. Ask how quickly replacement parts are available, what troubleshooting documents are provided, and whether staff can explain calibration without relying on sales language. A polished specification sheet is not proof of dependable field performance. The lowest quotation may leave out accessories, commissioning, or routine cleaning needs. Compare the complete setup, then check claims against a sample report or a practical demonstration. There is no perfect fit. Your site conditions should decide which trade-offs are acceptable.
Use these U.S. EPA treated-water turbidity benchmarks when comparing sensor range, resolution, accuracy, and reporting capability. The values are regulatory thresholds, not manufacturer performance data.
For conventional or direct filtration, combined filter effluent turbidity must be no greater than 0.3 NTU in at least 95% of monthly measurements and must never exceed 1 NTU. Confirm applicable requirements for your location and application. Source: U.S. EPA Surface Water Treatment Rules.
„Thanks to the LUVIR technology, the solder resist process could be switched directly from the previously used mask exposure to direct exposure. As an outstanding digital solution on the market, this technology has been able to demonstrate fast process times and superior quality on our certified conventional ink in production. This allowed us to fully digitize the solder mask process at low cost – without process or ink adjustments. An excellent benefit to our production in Rot am See.“
Ralf Göhringer (Head of Production WE Rot am See)
I would definitely recommend the Limata machine and team for a future company purchase
Michael Greenaway
Compunetics Inc.
“The Limata ldi has been amazing!! Best thing we did was buy this machine”
Richard Brady
GM
Circuitlabs
“Since 2019, we have been running the Limata X1000 LDI system (including LUVIR for solder mask imaging) in daily production as an addition to our current process with film. The machine was capable of properly exposing Taiyo PSR-4000 BN (DI) solder mask types on normal to high-copper boards using a new and unique direct imaging process. The machine operating interface is very user friendly which allowed for a quick technical training curve. The pre-registration processing reduced several seconds of production time at every print. Limata support and service staff is incomparable. They supported our team every step of the way at basically any time of the day or night, with literally, an immediate response time, customizing the software interface to best fit our Operations and needs.
We have exposed more than 8,000 prints since end of October, on various solder mask colors and some resist film panels. Limata, has proven to be very capable and innovative. They are a strong contender in the industry.
We have very much enjoyed this project, and working with the team!
Thank you Limata for the continued support and being a part of our growth.”
Bill Sezate
Vice President, GM
Summit Interconnect
As a replacement to our current contact exposure process with film, the LIMATA X2000 system including LUVIR-Technology was capable of properly exposing non-LDI solder mask types using a direct imaging process. The machine offers cutting edge software with a very intuitive operating interface which allowed for quick technician training curve. The dual drawer system combined with pre-registration processing reduced several seconds of production time at every machine cycle. Limata support and service staff is world class. They added software patches to keep production running at shortest possible response times, customized the software interface to best fit our in-house Operations system, and even wrote a step-by-step machine processing manual. As a result of the project, we have exposed more than 16,000 times on various product types and solder mask brands/colors. Limata, in a very short timeframe as a company, has definitely shown they are truly innovative and will be challenging the industry of direct imaging for the top spot.
Kevin Beattie
Process Engineer
TTM Technologies
Forest Grove Division