Computer Graphic Design Images shape how people notice, understand, and remember information across websites, products, and public spaces. A clear icon can guide a first-time visitor toward the right button. A thoughtful product image can show scale, texture, and use before a shopper reads a description. These visuals do more than decorate. They can turn abstract ideas into something people can scan and discuss.
Their importance is especially visible when attention is limited. On a phone screen, strong contrast and simple composition can make a message easier to find. In a training guide, a labeled diagram may explain a process faster than dense paragraphs. Yet polished graphics are not automatically effective. A beautiful image can confuse viewers if its symbols feel unfamiliar, its text is too small, or its colors lack sufficient contrast. Designs may look convincing on a large monitor, then lose key details on a small screen. That is worth remembering.
Good graphic design depends on purpose, audience, and context, not appearance alone. Designers should consider accessibility, image quality, cultural meaning, and how visuals work beside words. Testing with real users can reveal problems that a designer may overlook. Results are not always neat. Some choices still involve judgment, and a strong design may need revision after feedback. This article explores why Computer Graphic Design Images matter, how they support communication and recognition, and what makes them useful rather than merely attractive. It also considers their limits, because visual design works best when creativity is matched with clarity and care.
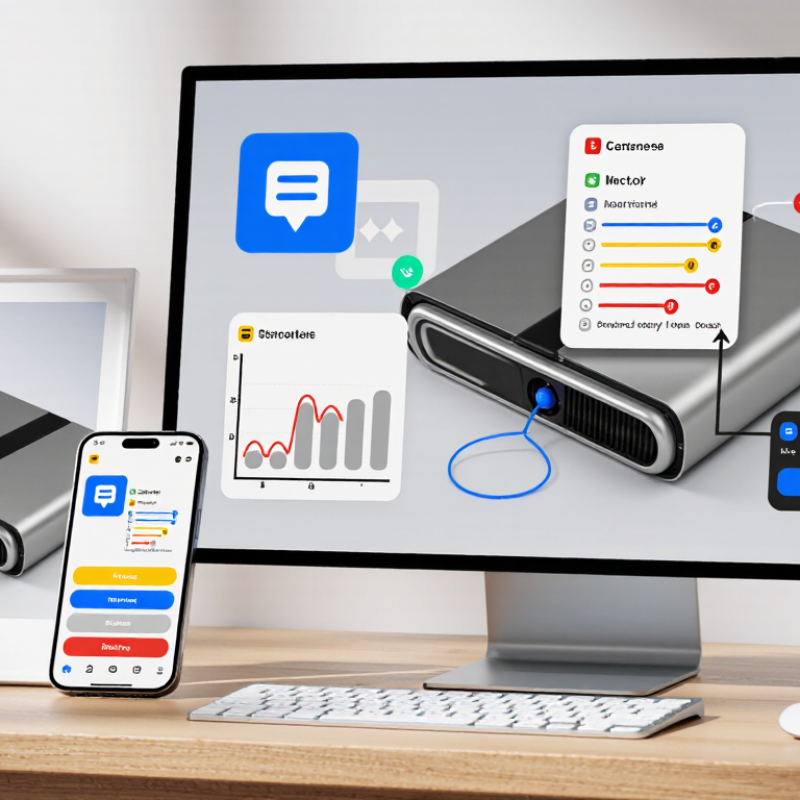
Computer graphic design images shape how people read, trust, and remember visual information. The right format depends on the job, not just the software used. Raster images store colored pixels, making them suited to photographs, textured backgrounds, and detailed product shots. But enlarge a small raster image, and its edges may look blocky. The HTTP Archive’s 2022 Web Almanac measured median desktop page weight at about 2.3 MB, with images accounting for roughly 1 MB. That makes image dimensions and compression practical design decisions, not minor technical details.
Vector graphics use paths and mathematical curves rather than fixed pixels. A simple icon or logo can stay crisp on a phone screen, poster, or large sign. Vectors also make color edits and shape adjustments easier. Yet they are not ideal for every image: complex photographic detail can make vector files cumbersome. Sometimes, less is clearer. I still check the result at its actual display size; a technically clean file can feel visually thin.
Three-dimensional graphics add depth, lighting, and perspective. They can show how a chair’s curved back meets its frame, or let a viewer inspect a package from several angles. That realism takes time, and polished rendering can sometimes look less honest than a plain photograph. Choose 3D when spatial understanding matters. For quick interface symbols, it may be unnecessary. Raster, vector, and 3D images each solve different visual problems, and the best choice can change as the design moves from screen to print.
Computer graphic design images do more than decorate a page. They help people find, compare, and understand information across screens and printed materials. A clear diagram can show how three steps connect, while a labeled chart makes differences easier to spot. Without visual structure, even accurate information can feel like a crowded drawer.
Designers use scale, spacing, color, and alignment to create an order readers can follow. On a phone screen, a bold heading and generous margins can keep instructions readable. In a printed guide, captions placed beside a photograph can explain a detail without interrupting the page. Small choices matter. A color difference that looks obvious on a monitor may fade when printed in grayscale, so contrast should be checked in the format people will actually use.
Images also shape how information is interpreted. A map with a clear legend can help readers locate services quickly; a confusing legend can send them in the wrong direction. Icons save space, but familiar shapes are not always understood in the same way by every audience. That can mislead. Testing layouts with real readers often reveals awkward gaps or labels that seemed clear only to the designer. Even then, no layout works perfectly for every person or device.
| Information Need | How Designed Images Help | Digital Media Example | Print Media Example | Key Design Consideration |
|---|---|---|---|---|
| Create visual hierarchy | Size, contrast, spacing, and placement signal which information readers should notice first. | A webpage uses a prominent page heading, smaller section headings, and a clear call-to-action button. | A poster gives its event title greater visual prominence than supporting details. | Use a consistent hierarchy so readers can scan content without confusing emphasis with importance. |
| Group related information | Proximity, alignment, and repeated visual styles show which items belong together. | A dashboard groups related measurements into labeled cards or chart panels. | A brochure places a service description beside its relevant image and caption. | Keep related elements visually close and separate unrelated groups with space or clear boundaries. |
| Explain data and processes | Charts, diagrams, and illustrated steps can make relationships or sequences easier to follow than text alone. | An annotated diagram shows how parts of a system connect on an instructional page. | An infographic arranges stages of a process in a numbered sequence. | Label visualizations clearly and avoid decorative effects that obscure values or relationships. |
| Support recognition and navigation | Consistent icons, colors, and page structures help people identify familiar categories and controls. | A navigation bar uses consistent labels and visual states for selected sections. | Repeated section markers help readers find chapters in a printed guide. | Do not rely on color alone to communicate meaning; pair it with labels, shapes, or patterns. |
| Improve accessibility | Readable typography, strong contrast, captions, and text alternatives make visual content easier to use. | Meaningful images have suitable alternative text, while charts include labels or a text summary. | Printed materials use legible type, sufficient contrast, and clear captions. | Check contrast and readability at the actual display or print size, and provide text equivalents where needed. |
| Adapt information to the medium | Design choices account for screen size, viewing distance, paper size, and how readers interact with content. | A responsive layout rearranges content for narrow screens without hiding essential information. | A large-format chart uses labels that remain readable from its intended viewing distance. | Test the design in its final context: on different screen sizes or as a physical print proof. |
A Stanford study reported that 46.1% of people judge a website’s credibility by its visual design. That number points to a quick, ordinary moment: a visitor lands on a page and decides whether it feels dependable. A crowded header, blurry product image, or mismatched font can create doubt before anyone reads the details. Clean design cannot prove that information is accurate. It can, however, make the information easier to examine.
Small choices shape that first impression. Consistent spacing helps readers find headings. Clear contrast makes buttons and labels easier to see. A sharp image showing a real product or workspace feels more useful than generic decoration. On mobile, even a menu that shifts unexpectedly can make a polished site feel careless. These details deserve testing on actual screens, not just a designer’s large monitor.
I would also be cautious about treating the 46.1% figure as a universal rule; audiences and research conditions differ. Design is not a trust guarantee. It is a signal, and sometimes an imperfect one. When reviewing a page, ask whether its visuals help visitors verify what they are seeing, or merely make the page look expensive.
Accessible graphics are not just attractive; they make information usable. WCAG 2.2 requires a contrast ratio of at least 4.5:1 for most text against its background. Large text, typically 18-point regular or 14-point bold, needs at least 3:1. These ratios compare relative luminance, not how vivid two colors appear. A bright yellow caption on white may look cheerful on a designer’s monitor, yet disappear on a phone in sunlight. Small type suffers. Testing the actual text and background colors is more reliable than judging by eye.
The WebAIM Million 2024 report found low-contrast text on 81% of the home pages it analyzed. That finding signals a widespread design problem, though it does not measure every graphic or user experience. For a practical check, place text over the exact image area behind it; a photograph’s changing shadows can make one color pair pass in one spot and fail nearby. Add a solid or translucent backing when needed, then test the finished graphic at realistic sizes. I still find it tempting to trust a polished screen preview. That instinct deserves scrutiny: contrast can shift with display settings, and a compliant ratio alone cannot make cramped or unclear text easy to read.
Choosing an image format is a practical design decision, not a cosmetic one. Raster files store pixels, so photographs usually work well as JPEG or WebP images. PNG preserves transparency and sharp edges, but detailed images can become much larger. Vector formats such as SVG keep logos and icons crisp at different display sizes. The trade-off is real. An SVG with complex effects may not be the simplest choice for every workflow.
Resolution matters just as much. A 1,200-pixel-wide image may look sharp in a web layout, yet appear soft when enlarged for a poster. For print, check the image’s pixel dimensions at its intended physical size; a high DPI label cannot restore missing detail. Bigger files can also slow page loading and use more memory on mobile devices. Small details matter. In a typical handoff, compare the exported file at its actual display size, then inspect its weight and transparency. It is easy to over-compress an image and miss the damage until fine hair, text, or a soft gradient looks rough. I would not treat one setting as a universal rule: the right balance depends on where the image will appear and how quickly it needs to load.
„Thanks to the LUVIR technology, the solder resist process could be switched directly from the previously used mask exposure to direct exposure. As an outstanding digital solution on the market, this technology has been able to demonstrate fast process times and superior quality on our certified conventional ink in production. This allowed us to fully digitize the solder mask process at low cost – without process or ink adjustments. An excellent benefit to our production in Rot am See.“
Ralf Göhringer (Head of Production WE Rot am See)
I would definitely recommend the Limata machine and team for a future company purchase
Michael Greenaway
Compunetics Inc.
“The Limata ldi has been amazing!! Best thing we did was buy this machine”
Richard Brady
GM
Circuitlabs
“Since 2019, we have been running the Limata X1000 LDI system (including LUVIR for solder mask imaging) in daily production as an addition to our current process with film. The machine was capable of properly exposing Taiyo PSR-4000 BN (DI) solder mask types on normal to high-copper boards using a new and unique direct imaging process. The machine operating interface is very user friendly which allowed for a quick technical training curve. The pre-registration processing reduced several seconds of production time at every print. Limata support and service staff is incomparable. They supported our team every step of the way at basically any time of the day or night, with literally, an immediate response time, customizing the software interface to best fit our Operations and needs.
We have exposed more than 8,000 prints since end of October, on various solder mask colors and some resist film panels. Limata, has proven to be very capable and innovative. They are a strong contender in the industry.
We have very much enjoyed this project, and working with the team!
Thank you Limata for the continued support and being a part of our growth.”
Bill Sezate
Vice President, GM
Summit Interconnect
As a replacement to our current contact exposure process with film, the LIMATA X2000 system including LUVIR-Technology was capable of properly exposing non-LDI solder mask types using a direct imaging process. The machine offers cutting edge software with a very intuitive operating interface which allowed for quick technician training curve. The dual drawer system combined with pre-registration processing reduced several seconds of production time at every machine cycle. Limata support and service staff is world class. They added software patches to keep production running at shortest possible response times, customized the software interface to best fit our in-house Operations system, and even wrote a step-by-step machine processing manual. As a result of the project, we have exposed more than 16,000 times on various product types and solder mask brands/colors. Limata, in a very short timeframe as a company, has definitely shown they are truly innovative and will be challenging the industry of direct imaging for the top spot.
Kevin Beattie
Process Engineer
TTM Technologies
Forest Grove Division